
A market is a group of buyers and sellers that interact to exchange a good or service.
Markets differ in their degree of organization (e.g., securities markets, housing markets with multiple listing services, farmer's market, lawn care, Ebay).
Markets often have an important geographical dimension, e.g., Capital District housing market. However, there are numerous examples where geography is relatively unimportant in determining the buyers and sellers that interact. Examples include the markets for many financial services and assets as well as personal computers.
Even though the institutional details of markets differ, markets have the common property that goods and services are exchanged and prices are determined. It is the interaction of buyers and sellers in the marketplace that determines price and quantity.
Markets are classified according to their degree of competition.
We first consider the case of perfect competition. The following relates to the behavior of buyers.
The quantity demanded is the amount of a good that a buyer is (buyers are) willing and able to purchase during a specified period of time. Quantity demanded refers to a particular number of units.
A change in the quantity demanded is the change in the quantity of the good that a buyer is (buyers are) willing and able to purchase. This is a change in the number of units.
What determines the quantity demanded? The quantity demanded by a consumer will depend upon the following factors:
• The good's own price.
• The consumer's income.
• The prices of related goods.
• The tastes and preferences of the consumer.
• Expectations and other special influences (e.g., weather).
(Think of these factors in the context of a particular good.)
In summary, Qd = f(own price, income, prices of related products, tastes, special influences) where Qd is the quantity demanded and f(.) is the notation used to represent a function; the quantity demanded is a function of the good’s own price, … .
First consider the relationship between the quantity demanded and the good's own price, ceteris paribus (i.e., other things being equal).
Vanessa's Demand Schedule
for video rentals (per month)
 Vanessa’s Vanessa’s demand schedules for video rentals |
|
|
quantity demanded |
price |
case A |
$10 |
2 |
$8 |
4 |
$6 |
6 |
$4 |
8 |
$2 |
10 |
A demand schedule is a table representation of the relationship between the price of a good and the quantity demanded, other things equal.
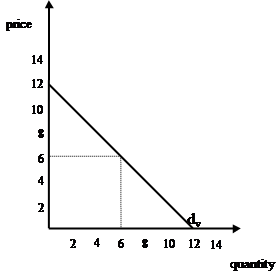
A demand curve is a graphical representation of the relationship between the price of a good and the quantity demanded, ceteris paribus.
The law of demand states that there is an inverse or negative relationship between a good's price and the quantity demanded, other things constant.
The law of demand is reflected in demand curves being downward sloping. This has the following implications:
• When the price of a good rises, the quantity demanded falls, other things equal.
• When the price of a good falls, the quantity demanded increases, other things equal.
In summary, demand is the relationship between the price of a good or service and the quantity demanded, other things held constant.
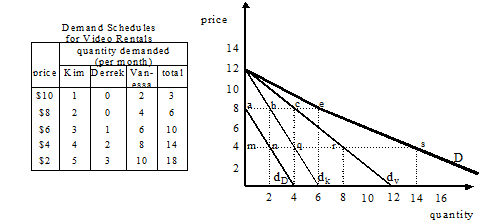
Market demand is the relationship between the price of a good or service and the quantity
demanded by all buyers in the market, ceteris paribus.
The market demand curve is obtained by horizontally summing the demand curves for all buyers in the market. See the following example.
An implication is that an increase in the number of buyers, ceteris paribus, will result in an increase in demand.
Now consider what happens if "other things" change, rather than remain constant?
Reconsider Vanessa's demand for video's, here shown as "case A." A change in one or more of the determinants of the quantity demanded, other than price, might lead to case B where, at each price, the quantity demanded is lower than in case A. This is an example of a change in the demand relationship.
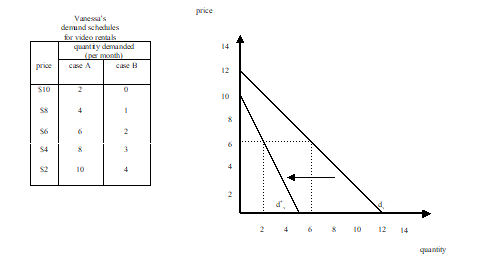
A change in demand is a change in the relationship between the quantity demanded and price, resulting from a change in some determinant other than the good's price. A change in demand is reflected in a shift of the demand curve.
Possible demand shifts:
reduction in demand: at each price, the quantity demanded decreases.
increase in demand: at each price, the quantity demanded increases.
Remember: A change in price does not result in a change in demand, i.e., the demand relationship reflected in a demand curve. (Remember, change in demand refers to a shift in the demand curve.) Rather, such a price change results in a movement along a given demand curve. A change in the price of a good results in a change in the quantity demanded but not a change in demand.
Changes in the demands of individual buyers result in changes in market demand. In addition, a change in the number of buyers will also lead to change in market demand, even if the demands of individual buyers remain unchanged. Example: Think about the effects of the baby-boom generation on the demand for various products.
The causes of a change in market demand are as follows:
Goods will often be substitutes when they serve similar purposes (e.g., butter and margarine).
Goods will often be complements when they are used together (e.g., bread and butter, gasoline and tires).
Some goods are unrelated in that a change in the price of one does not affect the demand for the other.
Examples: baseball caps, tattoos, oat bran, baseball caps (worn backward)
D. Changes in other influences.
Example: expectations regarding future prices and income, and weather.
Exercise 1: Show (graphically) how the demand for CD's is likely to be affected by each of the following: • A decrease in the price of CD's.
• A fall in the price of cassette tapes.
• An increase in the price of CD players.
• A decrease in the price of digital tape recorders.
• An increase in the price of milk.
• A new government program is implemented which gives every college student a payment of $1000 per month.
• There is increased interest in listening to live music, rather than recordings.
Exercise 2: Show graphically and explain what will happen to the demand for gasoline when:
Exercise 3: List various examples of factors that would cause a change in the demand for eggs.
Now consider the supply side of a market.
The quantity supplied is the quantity of a good a seller is (sellers are) willing and able to make available in the market over a given period of time.
Quantity supplied refers to a particular quantity.
A change in the quantity supplied is the change in the quantity of the good that a supplier is (suppliers are) willing and able to make available in the market over a given period, often as a result of a change in the good's price.
The quantity supplied of a good will depend upon the following factors:
• The good's own price.
• Prices of inputs used to produce the good.
• The technology regarding the transformation of inputs into the output.
• The prices of other goods the seller (sellers) could supply.
• Expectations.
In summary, Qs = g(own price, prices of inputs, technology, price of alternative products, expectations)
Supply is the relationship between the price of a good and the quantity supplied, holding other factors constant. This relationship can be represented in a supply schedule or a supply curve.
The following table shows a supply schedule for a farmer’s supply of eggs. In the space to the right, draw a graph that graphically represents the same information. Also plot the supply curve.
Price |
quantity supplied |
$ per dozen |
dozens per week |
0.25 |
20 |
0.50 |
30 |
0.75 |
40 |
1.00 |
50 |
1.25 |
60 |
1.50 |
70 |
1.75 |
80 |
2.00 |
90 |
Law of Supply: There is a direct or positive relationship between a good's price and the quantity supplied, other things equal.
The law of supply is reflected in supply curves being upward sloping. An implication is that the quantity supplied will be larger the higher is the good's price, ceteris paribus.
Market supply is the relationship between the price of a good or service and the quantity supplied by all sellers in the market, ceteris paribus.
The market supply curve is obtained by (horizontally) summing the supply curves for all sellers in the market. For example, in the following diagram, S is the horizontal summation of S1, S2 and S3.

price |
quantity supplied |
|||
$ per doz. |
firm 1 |
firm 2 |
firm 3 |
market total |
0.25 |
20 |
10 |
0 |
30 |
0.50 |
30 |
20 |
10 |
60 |
0.75 |
40 |
30 |
20 |
90 |
1.00 |
50 |
40 |
30 |
120 |
1.25 |
60 |
50 |
40 |
150 |
1.50 |
70 |
60 |
50 |
180 |
1.75 |
80 |
70 |
60 |
210 |
2.00 |
90 |
80 |
70 |
240 |
A change in supply is a change in the relationship between the quantity supplied and price that results from a change in a determinant other than the good’s price.
Examples of supply shifts:
increase in supply: at each price, the quantity supplied increases.
reduction in supply: at each price, the quantity supplied decreases.
Remember: A change in a good’s price does not result in a change in its supply (i.e., the supply relationship reflected in a supply curve). Rather, such a price change results in a movement along a given supply curve. The change in the price of a good results in a change in the quantity supplied, but not a change in supply.
A change in supply can result from each of the following:
Exercise 4:
Explain and show graphically how the supply of personal computers is affected by each of the following:
1. There is an increase in the wages paid to workers having the skills needed to build computers.
2. There is a decline in the prices of computer components.
3. There are improvements in knowledge of how to assemble computers.
4. The market price of trucks increases.
5. IBM decides to stop making personal computers.
6. The market price of personal computers declines.
Exercise 5:
Think of various examples of factors that would cause a change in the supply of eggs.
Interaction of Supply and Demand
Now consider how demand and supply interact to determine the market price as well as the quantity transacted.
Digression:
Equilibrium is the state of balance between opposing forces. In equilibrium, the system is in a state of rest as there is no tendency for change. Example: children on a see-saw.
In economics, there is an “equilibrium” when economic forces are in balance. In such a case, economic variables will have no tendency to change.
Suppose that the market demand and supply of eggs are as follows:
Market Demand and Supply for Eggs |
||||
Price |
quantity |
quantity |
shortage or surplus |
pressure on price |
0.25 |
8,000 |
2,000 |
shortage |
upward |
0.50 |
7,000 |
3,000 |
shortage |
upward |
0.75 |
6,000 |
4,000 |
shortage |
upward |
1.00 |
5,000 |
5,000 |
none |
none |
1.25 |
4,000 |
6,000 |
surplus |
downward |
1.50 |
3,000 |
7,000 |
surplus |
downward |
1.75 |
2,000 |
8,000 |
surplus |
downward |
2.00 |
1,000 |
9,000 |
surplus |
downward |
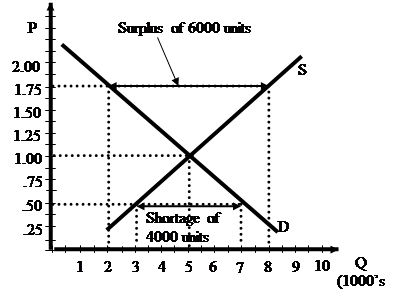
There is excess demand or shortage when, at a given price, the quantity demanded exceeds the quantity supplied. For example, at a price of $0.50 per dozen there is a shortage of 4000 units (i.e., dozens of eggs).
A shortage (excess demand) results in upward pressure on price.
There is surplus or excess supply when, at a given price, the quantity demanded is less than the quantity supplied. In the above example, if the price of eggs was $1.75 per dozen, there would be a surplus of 6000 dozen eggs.
A surplus (excess supply) results in downward pressure on price.
When the quantity demanded equals the quantity supplied, demand and supply forces will be in balance so that there will be no tendency for price to change.
A market equilibrium exists when the price of a good is such that the quantity demanded is equal to the, quantity supplied.
There is equilibrium at the market price because the quantity demanded equals the quantity supplied; the number of units that buyers are willing and able to purchase exactly equals the number of units that sellers are willing and able to sell.
The terms equilibrium price and equilibrium quantity are used to denote the price and quantity that correspond to the market equilibrium.
Law of demand and supply: The market price of a good will adjust so that supply and demand forces will be in balance.
The details of how a market moves to the equilibrium price and quantity differs depending upon the organization of the market. Consider an oral auction with an auctioneer. Even though there are no auctioneers in most competitive markets, the markets tend to be self-equilibrating because of the competition between buyers and sellers.
The law of demand and supply implies that the equilibrium price and quantity will be attained. Furthermore, if the market demand and supply curves remain unchanged, there will be no tendency for price and quantity traded in the market to change. Only if there is a change in demand or supply, or both, will the equilibrium price and quantity change.
Consider how equilibrium price and equilibrium quantity change as a result of changes in demand or supply, or both.
A. An increase in demand, ceteris paribus, will result in equilibrium price and quantity both increasing.
With demand and supply curves D1 and S, respectively (shown below) the initial equilibrium is at price P1 and quantity Ql.
Now consider an increase in demand from D1 to D2. At what had been the equilibrium price, P1, there is now an excess demand of Q3 – Q1 units. Reflecting this excess demand, market forces will cause the price to rise. The new equilibrium will be at price P2 and quantity Q2. Note that both the equilibrium price and quantity both have increased.
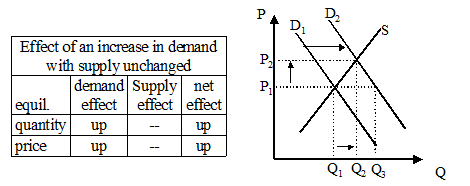
Reconsider the situation after demand had increased but before price changed from the initial level of P1 – there is excess demand of Q3 – Q1 units. Notice how the rise in price eliminates this excess demand. The increase in price from P1 to P2 results in an increase in the quantity supplied from Q1 to Q2 (movement along the supply curve S) and a reduction in the quantity demanded from Q3 to Q2 (movement along the new demand curve, D2). In this way, the increase in price leads to the elimination of the shortage.
NOTE: The increase in demand results in an increase in the quantity supplied, but not an increase in supply.
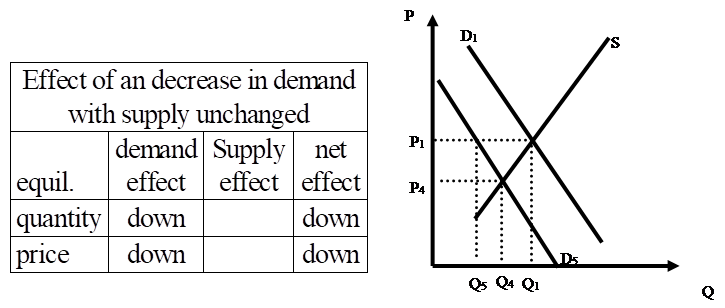
B. A decrease in demand, ceteris paribus, will result in decreases in both the equilibrium price and the equilibrium quantity.
Exercise: Write out an explanation similar to that in case A, explaining how a decrease in demand from D1 to D5 causes the equilibrium price and equilibrium quantity to fall.
C. An increase in supply, ceteris paribus, will result in reduction in the equilibrium price and an increase in the equilibrium quantity.
With demand and supply curves D and Sa, respectively, the initial equilibrium is at price P1 and quantity Q1.
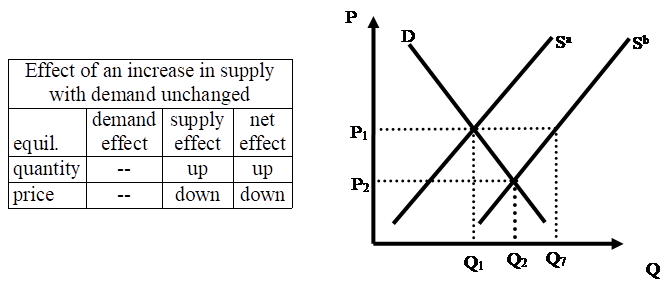
Now consider an increase in supply from Sa to Sb. At P1, which had been the equilibrium price before the change in supply, there is now an excess supply of Q7 – Q1 units. Reflecting this excess supply, market forces will cause the price to fall from P1. The reduction in price results in an increase in the quantity demanded (movement along the demand curve D) and a reduction in the quantity supplied (movement along the new supply curve, Sb). These changes lead to a reduction in, and ultimately the elimination of, the initial excess supply. The new equilibrium will be at price P2 and quantity Q2. Note that the equilibrium price has fallen and the equilibrium quantity has increased.
D. A decrease in supply, ceteris paribus, will result in an increase in the equilibrium price and a reduction in the equilibrium quantity.
Exercise: Draw the demand and supply curves for a product and show that a decrease in supply will result in an increase in the equilibrium price and a reduction in the equilibrium quantity. Write an explanation similar to those above, explaining your analysis in detail.

Now consider combinations of changes in demand and supply.
E. An increase in demand accompanied by an increase in supply will result in an increase in the equilibrium quantity. The equilibrium price could rise, fall or remain unchanged - depending on the relative magnitudes of the shifts in demand and supply. This can be seen by considering the changes in demand and supply one at a time.
In each of the following two diagrams, demand increases from D1 to D2 and supply increases from S1 to S2.
In case 1, the increase in demand is large relative to the increase in supply. If price remained at the initial level, P1, there would be a shortage (excess demand), which result in an increase in market price (P1 to P2). Thus, in this case, the changes in demand and supply together result in an increase in the equilibrium price.
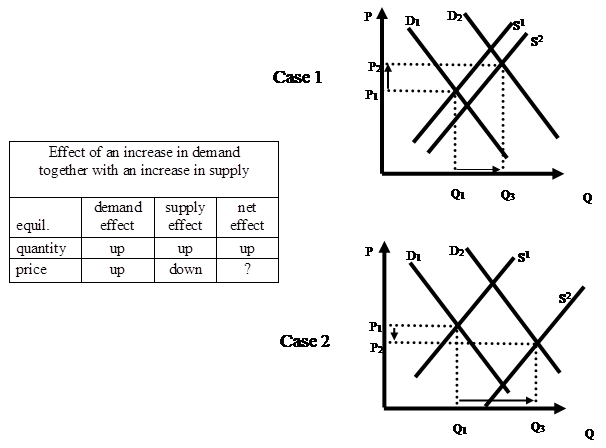
In case 2. The increase in supply being large relatively to the increase in demand results in there being an excess supply at P1 (given the new demand and supply curves). This leads to a fall in the market price.
In general, whether the equilibrium price rises, falls or remains unchanged depends upon whether the change in demand or the change in supply is larger (at the initial equilibrium price).
Note: with increases in both demand and supply the equilibrium quantity always increases.
F. An increase in demand accompanied by a decrease in supply will result in an increase in the equilibrium price. The equilibrium quantity could rise, fall or remain unchanged - depending on the relative magnitudes of the shifts in demand and supply. Again, this can be seen by considering the changes in demand and supply one at a time.
Effects of an increase in demand together with a decrease in supply |
|||
equilibrium |
demand effect |
supply effect |
net effect |
quantity |
up |
down |
? |
price |
up |
up |
up |
Practice drawing demand and supply curves showing the pre- and post-change equilibria and demonstrate that the equilibrium price must rise but that the equilibrium quantity could increase or fall.
Whether the equilibrium quantity rises, falls or remains unchanged depends upon whether the demand effect or the supply effect dominates. This will be determined by whether (after the changes in demand and supply) there is an excess demand or an excess supply at the pre-change equilibrium price.
G. A decrease in demand accompanied by an increase in supply will result in a decrease in the equilibrium price. The equilibrium quantity could rise, fall or remain unchanged - depending upon the relative magnitudes of the shifts in demand and supply.
Effects of an decrease in demand |
|||
equilibrium |
demand effect |
supply effect |
net effect |
quantity |
down |
up |
? |
price |
down |
down |
down |
H. A decrease in demand accompanied by a decrease in supply will result in a decrease in the equilibrium quantity. The equilibrium price could rise, fall or remain unchanged, depending upon the relative magnitudes of the shifts in demand and supply.
Effects of an decrease in demand |
|||
equilibrium |
demand effect |
supply effect |
net effect |
quantity |
down |
down |
down |
price |
down |
up |
? |
A four-step analysis can be used to work through how various changes affect equilibrium price and quantity.
1. Characterize the initial equilibrium (e.g., identify the equilibrium price and quantity).
Examples:
Consider the market for detached single family housing and analyze the effects of the following changes:
The above examples are applications of comparative static analysis, which is the analysis of how the equilibrium price and quantity in a market change as a result of changes in factors external (exogenous) to the market. (Remember that demand and supply interact to determine the price and quantity traded in a market. However, there are a variety of factors external to the market that can affect demand and/or supply.)
The analysis also can be reversed. Rather than consider the changes in equilibrium price and quantity that would result from changes in the determinants of demand and supply, consider what changes in the determinants of supply and demand could possibly explain observed changes in a good's equilibrium price and quantity.
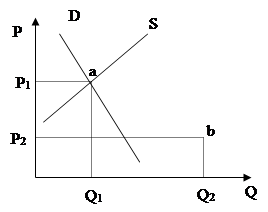
For example, consider the market for personal computers where there has been an increase in the equilibrium quantity accompanied by very large reductions in equilibrium price. How can such a change from point a to b explained in terms of changes in demand and supply?
The above comparative static analyses of how changes in demand and supply affect equilibrium price and equilibrium quantity are applicable for all competitive markets.
Examples of Different Markets |
||||
Market |
Good |
Price |
Buyers |
sellers |
rental housing |
housing units |
rental rate per unit |
Tenants |
landlords |
wholesale lettuce |
lettuce (pounds) |
price per pound |
produce farmers |
wholesalers |
credit |
loans |
interest rate per year |
Borrowers |
lenders |
labor |
hour worked |
wage per hour |
Firms |
individuals |
foreign exchange |
yen |
dollars per yen |
those wanting yen |
those wanting to liquidate yen |
crude oil |
crude oil |
dollars per barrel |
refiners |
oil field owners |
personal computer |
personal computers |
dollars per computer |
Individuals |
computer companies |
Source: http://www.albany.edu/faculty/hamp/aeco110m/2.doc
Web site to visit: http://www.albany.edu
Author of the text: indicated on the source document of the above text
If you are the author of the text above and you not agree to share your knowledge for teaching, research, scholarship (for fair use as indicated in the United States copyrigh low) please send us an e-mail and we will remove your text quickly. Fair use is a limitation and exception to the exclusive right granted by copyright law to the author of a creative work. In United States copyright law, fair use is a doctrine that permits limited use of copyrighted material without acquiring permission from the rights holders. Examples of fair use include commentary, search engines, criticism, news reporting, research, teaching, library archiving and scholarship. It provides for the legal, unlicensed citation or incorporation of copyrighted material in another author's work under a four-factor balancing test. (source: http://en.wikipedia.org/wiki/Fair_use)
The information of medicine and health contained in the site are of a general nature and purpose which is purely informative and for this reason may not replace in any case, the council of a doctor or a qualified entity legally to the profession.
The texts are the property of their respective authors and we thank them for giving us the opportunity to share for free to students, teachers and users of the Web their texts will used only for illustrative educational and scientific purposes only.
All the information in our site are given for nonprofit educational purposes